
Vending Sales Growth Starts from a Small Base: Show the Units Alongside the Percentage
A large percentage increase in vending sales can come from only a few extra purchases when the starting figure is small. Show the unit counts alongside the percentage before deciding that a product has become a major success. The percentage describes relative change; the counts show the scale that matters for stock and operating decisions.
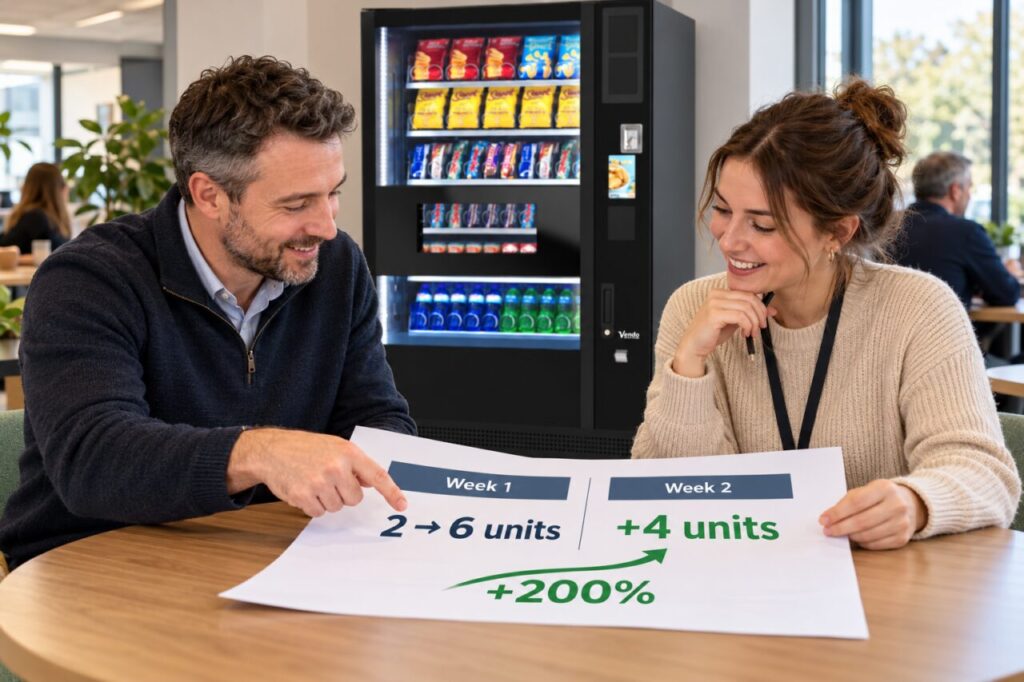
Suppose an illustrative product sells two units in one comparable week and six in the next. Sales have increased by four units, or 200% relative to the original two. That is a correct calculation, but it does not mean the product now sells hundreds of units or that the same growth will continue next week.
State the starting and ending figures
Write the comparison in a form another person can check: two units, then six units, an increase of four. Add the percentage afterwards if it helps. Keep units separate from revenue and transactions. A change in pack price or several items bought in one transaction can make those measures move differently over the same period.
Use the original period as the denominator when calculating percentage growth. The increase divided by the original figure, multiplied by 100, gives the percentage change. If the original figure is zero, ordinary percentage growth is undefined. Report the move from zero to the new count rather than inventing an infinite or arbitrary percentage.
Check whether the periods are comparable
Confirm that the product was available for a similar amount of time and that the machine was accessible. A product absent from the first week cannot provide a normal demand baseline. Likewise, a special event, an unusual bulk purchase or a temporary price change may explain part of the increase without establishing a lasting pattern.
Record these conditions beside the comparison. Do not remove an unusual event merely to obtain a preferred result, but show its effect separately where the records allow. If the data are incomplete, state the limitation. A confident growth headline cannot compensate for a missing day, an uncertain pack mapping or an unexplained change in reporting scope.
Translate growth into a stock decision
Ask what the extra units mean for the next refill. An increase from two to six may justify continuing a trial, but it does not automatically justify a large case order. Consider the actual quantity, current stock, replenishment schedule and the product’s relevant shelf-life information. Avoid turning a relative percentage into an unsupported demand forecast.
In a vending business review, compare the product’s contribution with the rest of the range. A modest percentage increase on a well-established line may represent more additional units than a dramatic percentage on a new line. Both can be useful observations, but they support different decisions about space, stock and further testing.
Review the pattern before calling it sustained
Continue collecting comparable observations over an appropriate period for the site. Keep the original trial question in view and note changes to availability or price. Do not promise a particular future growth rate from two observations. A short run of sales is evidence about that period, not proof of a stable long-term trend.
When communicating the result, lead with the practical scale and explain the conditions. “Four more units in a comparable week” is easier to act on than an isolated 200% headline. Clear reporting lets the operator recognise genuine improvement while keeping the purchase quantities and expectations proportionate to what the records actually show.
Related guidance: A Vending Refund Rate Looks High on a Quiet Day: Show the Counts Behind the Percentage.
For help assessing your site, contact Vending-Machines.ie.


