
Vending Sales per Open Hour: Compare Sites with Different Access Times
Two vending sites can produce different weekly sales partly because customers have different amounts of time to use them. Sales per open hour can add context when one venue offers daytime access and another operates for longer. Use it alongside total sales, not as a replacement for the actual income and cost record.
The measure needs a clear definition of open. A machine being powered is not necessarily accessible to customers. Decide which hours belong in the calculation and document that choice before comparing sites. Otherwise, a precise-looking rate can conceal inconsistent access assumptions.
Define the period and access hours
Use the same reporting period for both sites. Obtain the actual customer access schedule, including closures or restricted days. If a machine is behind a locked door during evenings, do not count those hours merely because the wider building is open. Record the source of the schedule so another person can reproduce the calculation.
Separate planned opening hours from machine downtime. You may want one measure based on normal venue access and another based on confirmed service availability, but label them differently. Removing all unavailable hours can make a troubled site look stronger without showing the sales opportunity it lost. Keep the downtime visible in the review.
Calculate with consistent sales data
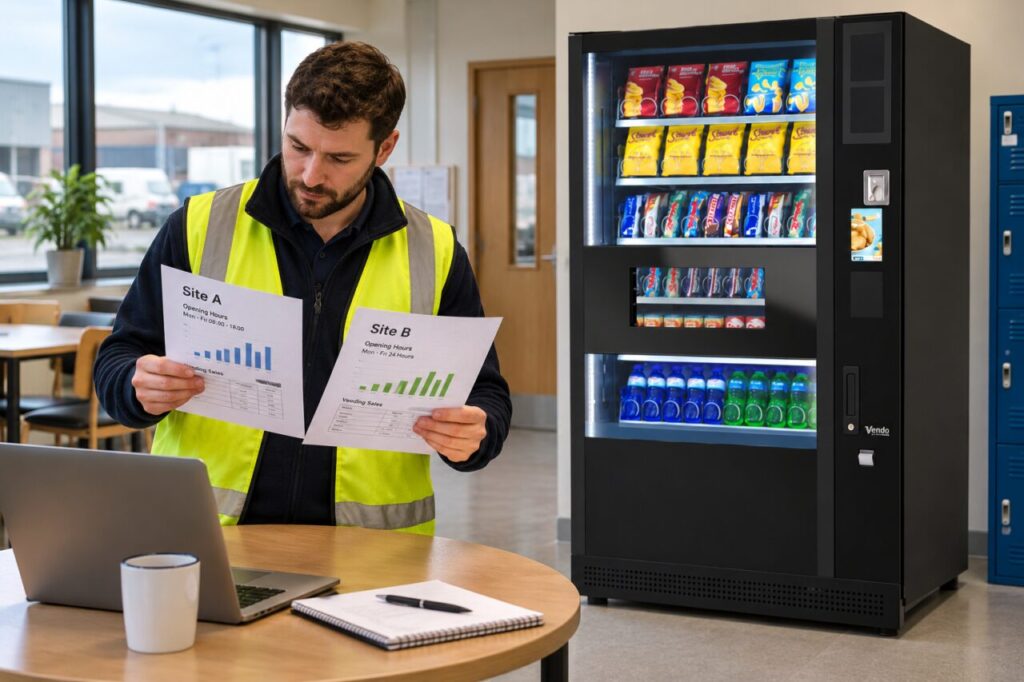
For an illustrative example, Site A records 400 purchases over 40 open hours. That is 10 purchases per open hour. Site B records 600 purchases over 100 open hours, or six purchases per hour. Site B has more total purchases, while Site A has the higher hourly rate. Neither result contradicts the other.
Choose whether you are comparing transaction counts, units or sales value and keep that choice consistent. A transaction can contain a different number of items depending on the system. If comparing monetary value, use the same reporting basis at each site and state how adjustments are handled rather than mixing unlike totals.
Interpret the rate with care
An average across opening hours does not show peak demand. Site B might have quiet overnight hours and a very busy lunch break. Review time-based detail where reliable data is available before changing capacity or refill arrangements. Do not assume that six purchases per hour means six purchases in every individual hour.
Also consider the available audience and product range. A higher hourly rate is not proof that one operator is better or that another site should be removed. The measure describes observed activity relative to access time. It does not explain the whole business case, customer need or service obligation at either location.
Use the comparison for a specific decision
If the question concerns service hours, review when purchases occur and whether the venue is considering a real access change. If it concerns stock, examine product-level availability and demand. If it concerns profitability, bring in the actual costs. Keep the hourly sales calculation as one useful input rather than allowing it to answer every question.
Save the source totals, access hours and calculation beside the decision note. Repeat the method consistently when the schedule changes, showing the old and new basis. This makes it possible to tell whether a rate changed because purchases changed, because access hours changed or because the definition was revised. A transparent comparison is more useful than a league table with no explanation of what its denominator means.
Discuss your site and equipment requirements with Vending-Machines.ie, or send an enquiry with the questions your comparison has identified.
Related guidance: Vending Sales Reports Use Different Cut-Off Times: Align the Period Before Comparing.