Vending Sales per Opening Hour: Compare Sites with Different Schedules
A vending machine in a building open for longer may sell more items simply because customers can reach it for more hours. Sales per opening hour can help compare sites with different schedules, provided the hours describe real customer access. It is a supporting measure, not a complete verdict on profitability or service quality.
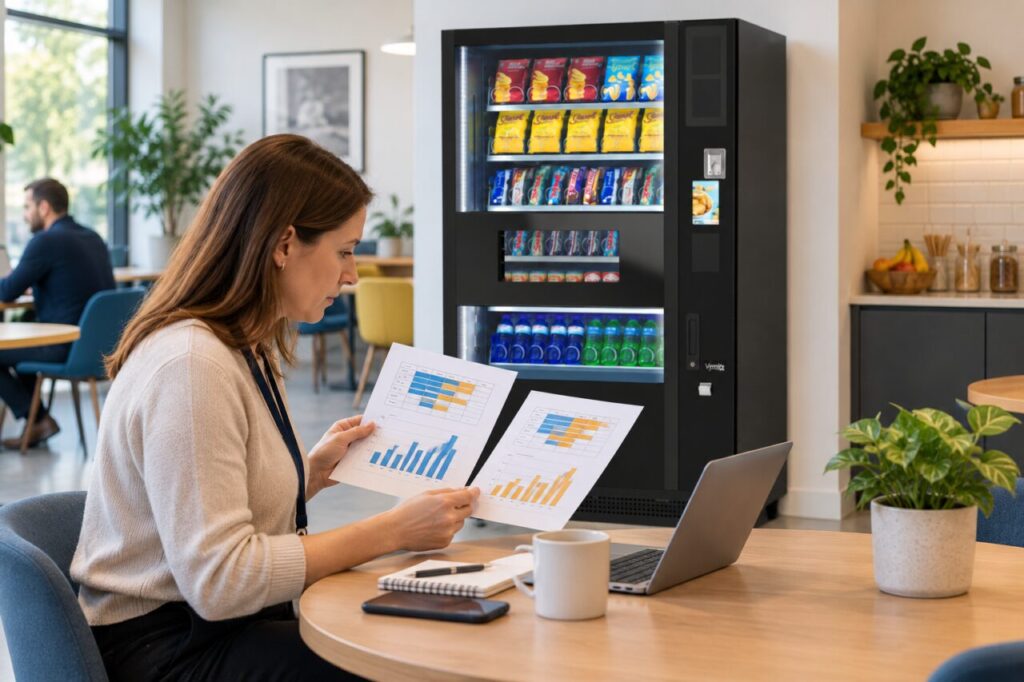
Start with the same period for both sites and use recorded item sales where available. Distinguish building opening hours from access to the machine itself. A reception door may remain open while the refreshment room is locked, or evening visitors may use a route that bypasses the machine. Those differences belong in the interpretation.
Calculate the rate from totals
Suppose Site A sells 300 items during 50 accessible hours in a week. Its rate is six items per accessible hour. Site B sells 280 items during 35 accessible hours, giving eight per hour. These invented figures show that the site with fewer total sales can have the higher hourly rate. They are not expected results for an Irish location.
Keep both total and rate in the report. Site A still sold 20 more items in this example. Site B’s higher rate does not establish higher profit because the product mix, costs and service effort may differ. Use the measure to ask why the buying intensity differs, then examine the information needed for the actual decision.
Do not average daily rates blindly
A two-hour day with 20 sales has a rate of ten per hour. An eight-hour day with 40 sales has a rate of five. The simple average of those two rates is 7.5, but total sales divided by total hours is 60 divided by ten, or six per hour. The latter gives the combined rate weighted by the hours represented.
This distinction matters where weekend access is shorter than weekday access. Keep the daily figures for context, but calculate the period rate from the period’s totals. If reporting a typical day’s rate instead, label that different statistic explicitly. A colleague should be able to reproduce the result without guessing whether every day received equal weight.
Record interruptions and access limits
Keep closures, maintenance downtime and missing data visible. Decide in advance whether the measure uses scheduled access hours or verified available hours, and state the choice. These answer different questions. Scheduled hours may reveal the effect of service interruptions; available hours may describe demand while the machine could actually be used.
Do not deduct downtime unless the timing is supported by a reliable record. An estimated interruption should remain labelled as an estimate. Also note stock availability: a machine can be accessible while a popular selection is empty. A lower rate in that period may reflect limited choice rather than a general lack of customer interest.
Use the result to improve the next review
Look at busy intervals separately if the weekly rate hides sharp peaks. Eight sales per hour across a week does not mean eight arrive evenly every hour. Compare the pattern with breaks, shift changes and visitor activity before changing refill times. Keep customers’ actual access needs central rather than optimising a single ratio.
When planning or reviewing a vending business, combine hourly rates with total sales, contribution, service time and site objectives. Repeat the calculation over another comparable period before treating a difference as persistent. The useful question is what the schedule explains and what action is justified, not which site can be declared the winner from one number.
For a proposal suited to your site, contact our team with the location, expected users and your main requirements.
Related guidance: Office Vending at Weekends: Review Demand Separately from Weekdays.